What is FastQC
Modern high throughput
sequencers can generate hundreds of millions of sequences in a single run.
Before analysing this sequence to draw biological conclusions you should always
perform some simple quality control checks to ensure that the raw data looks
good and there are no problems or biases in your data which may affect how you
can usefully use it.
Most sequencers will
generate a QC report as part of their analysis pipeline, but this is usually
only focused on identifying problems which were generated by the sequencer
itself. FastQC aims to provide a QC report which can spot problems which
originate either in the sequencer or in the starting library material.
FastQC can be run in one
of two modes. It can either run as a stand alone interactive application for
the immediate analysis of small numbers of FastQ files, or it can be run in a
non-interactive mode where it would be suitable for integrating into a larger
analysis pipeline for the systematic processing of large numbers of files.
Evaluating
Results
The
analysis in FastQC is performed by a series of analysis modules. The left hand
side of the main interactive display or the top of the HTML report show a
summary of the modules which were run, and a quick evaluation of whether the
results of the module seem entirely normal (green tick), slightly abnormal
(orange triangle) or very unusual (red cross).It is important to stress that although the analysis results appear to give a pass/fail result, these evaluations must be taken in the context of what you expect from your library. A 'normal' sample as far as FastQC is concerned is random and diverse. Some experiments may be expected to produce libraries which are biased in particular ways. You should treat the summary evaluations therefore as pointers to where you should concentrate your attention and understand why your library may not look random and diverse.
FastQC Installation
To Run Type:
- sudo apt-get update
- sudo apt-get install fastqc
if it is showing java error
- fastqc &
bio@ubuntu:~$ fastqc &
rafay@ubuntu:~$ Exception in thread "main" java.awt.HeadlessException:
No X11 DISPLAY variable was set, but this program performed an operation which requires it.
then you can tryafter execution it will save results on html file which you can open on your web browsers.
- fastqc filename.fastq &
Basic
Statistics
Summary
The
Basic Statistics module generates some simple composition statistics for the
file analysed.- Filename: The
original filename of the file which was analysed
- File type: Says
whether the file appeared to contain actual base calls or colorspace data
which had to be converted to base calls
- Encoding: Says
which ASCII encoding of quality values was found in this file.
- Total Sequences:
A count of the total number of sequences processed. There are two values
reported, actual and estimated. At the moment these will always be the
same. In the future it may be possible to analyse just a subset of
sequences and estimate the total number, to speed up the analysis, but
since we have found that problematic sequences are not evenly distributed
through a file we have disabled this for now.
- Filtered
Sequences: If running in Casava mode sequences flagged to be filtered will
be removed from all analyses. The number of such sequences removed will be
reported here. The total sequences count above will not include these
filtered sequences and will the number of sequences actually used for the
rest of the analysis.
- Sequence Length:
Provides the length of the shortest and longest sequence in the set. If
all sequences are the same length only one value is reported.
- %GC: The overall
%GC of all bases in all sequences
Per
Base Sequence Quality
Summary
This
view shows an overview of the range of quality values across all bases at each
position in the FastQ file.For each position a BoxWhisker type plot is drawn. The elements of the plot are as follows:
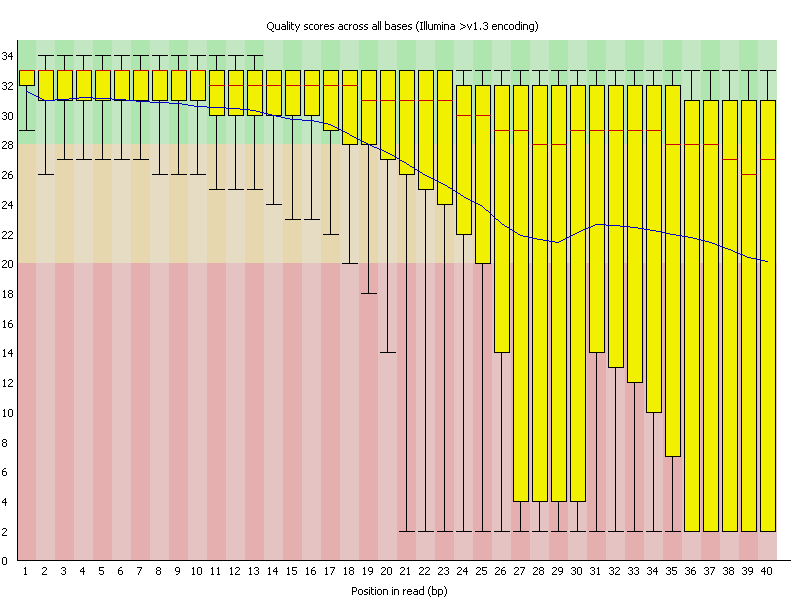
- The central red
line is the median value
- The yellow box
represents the inter-quartile range (25-75%)
- The upper and
lower whiskers represent the 10% and 90% points
- The blue line
represents the mean quality
It should be mentioned that there are number of different ways to encode a quality score in a FastQ file. FastQC attempts to automatically determine which encoding method was used, but in some very limited datasets it is possible that it will guess this incorrectly (ironically only when your data is universally very good!). The title of the graph will describe the encoding FastQC thinks your file used.
Results from this module will not be displayed if your input is a BAM/SAM file in which quality scores have not been recorded.
Per
Sequence Quality Scores
Summary
The per sequence quality score report allows you to see if a subset of your sequences have universally low quality values. It is often the case that a subset of sequences will have universally poor quality, often because they are poorly imaged (on the edge of the field of view etc), however these should represent only a small percentage of the total sequences.
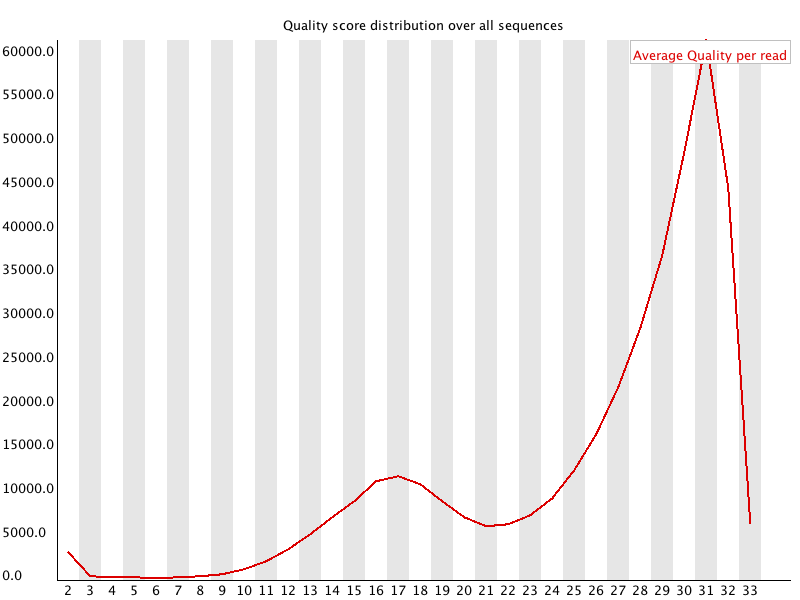
If a significant proportion of the sequences in a run have overall low quality then this could indicate some kind of systematic problem - possibly with just part of the run (for example one end of a flowcell).
Results from this module will not be displayed if your input is a BAM/SAM file in which quality scores have not been recorded.
Per
Base Sequence Content
Summary
Per Base Sequence Content plots out the proportion of each base position in a file for which each of the four normal DNA bases has been called.
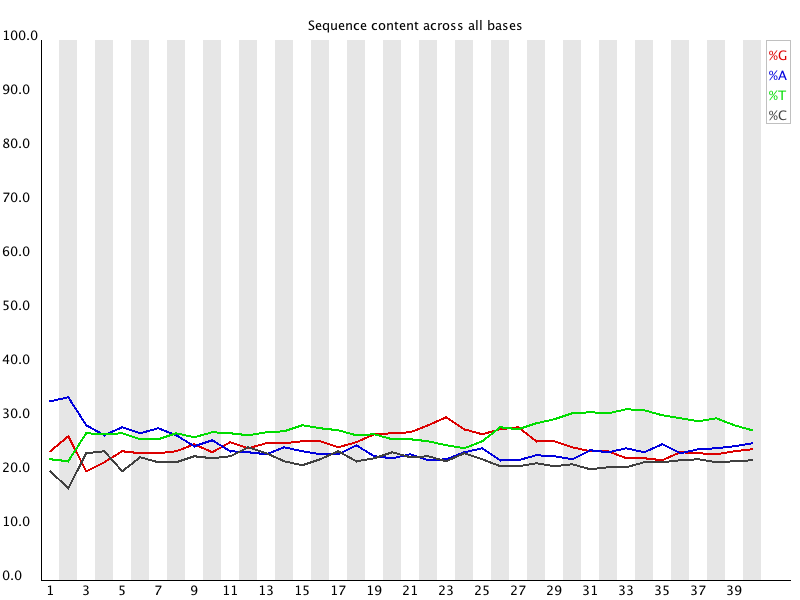
In a random library you would expect that there would be little to no difference between the different bases of a sequence run, so the lines in this plot should run parallel with each other. The relative amount of each base should reflect the overall amount of these bases in your genome, but in any case they should not be hugely imbalanced from each other.
It's worth noting that some types of library will always produce biased sequence composition, normally at the start of the read. Libraries produced by priming using random hexamers (including nearly all RNA-Seq libraries) and those which were fragmented using transposases inherit an intrinsic bias in the positions at which reads start. This bias does not concern an absolute sequence, but instead provides enrichement of a number of different K-mers at the 5' end of the reads. Whilst this is a true technical bias, it isn't something which can be corrected by trimming and in most cases doesn't seem to adversely affect the downstream analysis. It will however produce a warning or error in this module.
Per
Sequence GC Content
Summary
This module measures the GC content across the whole length of each sequence in a file and compares it to a modelled normal distribution of GC content.
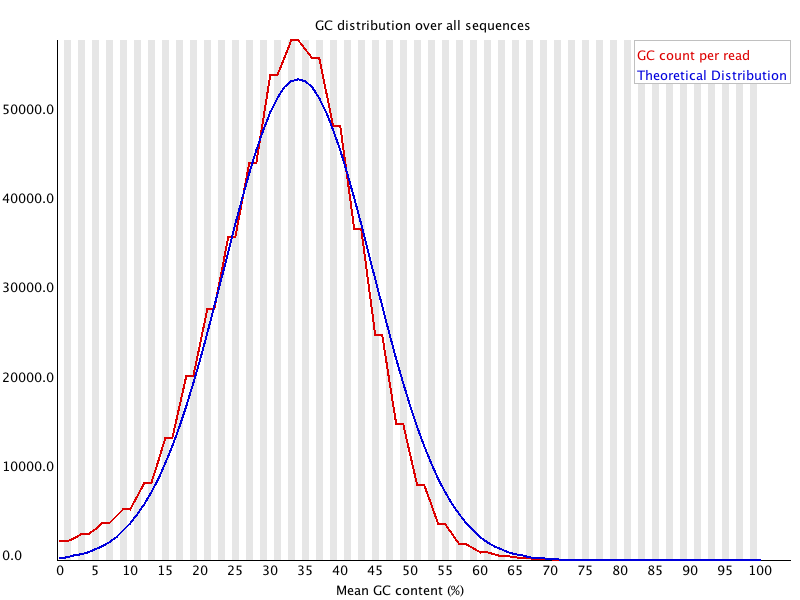
In a normal random library you would expect to see a roughly normal distribution of GC content where the central peak corresponds to the overall GC content of the underlying genome. Since we don't know the the GC content of the genome the modal GC content is calculated from the observed data and used to build a reference distribution.
An unusually shaped distribution could indicate a contaminated library or some other kinds of biased subset. A normal distribution which is shifted indicates some systematic bias which is independent of base position. If there is a systematic bias which creates a shifted normal distribution then this won't be flagged as an error by the module since it doesn't know what your genome's GC content should be.
Per Base N Content
Summary
If
a sequencer is unable to make a base call with sufficient confidence then it
will normally substitute an N rather than a conventional base] callThis module plots out the percentage of base calls at each position for which an N was called.
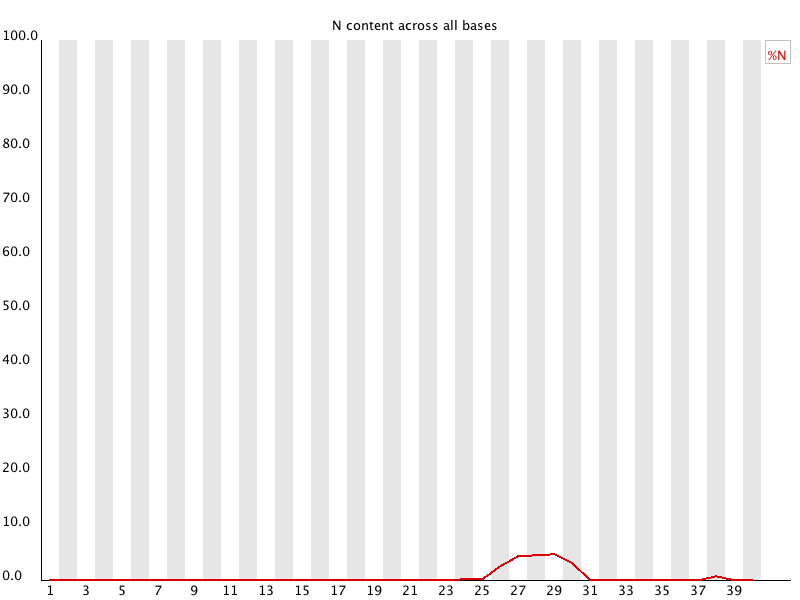
It's not unusual to see a very low proportion of Ns appearing in a sequence, especially nearer the end of a sequence. However, if this proportion rises above a few percent it suggests that the analysis pipeline was unable to interpret the data well enough to make valid base calls.
No comments:
Post a Comment